01_demo — Notebook de test#
# Vérif kernel Thebe/Binder
import sys, platform
print("Python:", sys.version.split()[0], "|", platform.platform())

import numpy as np, pandas as pd, matplotlib
print("NumPy:", np.__version__, "| Pandas:", pd.__version__, "| Matplotlib:", matplotlib.__version__)
Python: 3.11.13 | Linux-6.6.87.2-microsoft-standard-WSL2-x86_64-with-glibc2.35
NumPy: 2.3.2 | Pandas: 2.3.2 | Matplotlib: 3.10.6
# Initialisation
import sys, platform
import numpy as np
import pandas as pd

print("Python:", sys.version.split()[0])
print("NumPy:", np.__version__, "| Pandas:", pd.__version__)
print("Platform:", platform.platform())

np.random.seed(0)
Python: 3.11.13
NumPy: 2.3.2 | Pandas: 2.3.2
Platform: Linux-6.6.87.2-microsoft-standard-WSL2-x86_64-with-glibc2.35
01_demo — Notebook de test#
import numpy as np
import matplotlib.pyplot as plt
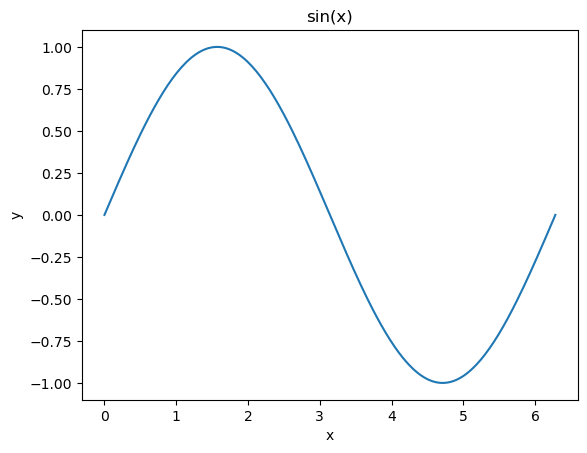
x = np.linspace(0, 2*np.pi, 200)
y = np.sin(x)
plt.figure()
plt.plot(x, y)
plt.title("sin(x)")
plt.xlabel("x")
plt.ylabel("y")
plt.show()
01_demo — Notebook de test#
import pandas as pd
from IPython.display import display

df = pd.DataFrame({"a": [1, 2, 3, 4], "b": [10, 20, 10, 30]})
display(df)
df.describe()
| a | b | |
|---|---|---|
| 0 | 1 | 10 |
| 1 | 2 | 20 |
| 2 | 3 | 10 |
| 3 | 4 | 30 |
| a | b | |
|---|---|---|
| count | 4.000000 | 4.000000 |
| mean | 2.500000 | 17.500000 |
| std | 1.290994 | 9.574271 |
| min | 1.000000 | 10.000000 |
| 25% | 1.750000 | 10.000000 |
| 50% | 2.500000 | 15.000000 |
| 75% | 3.250000 | 22.500000 |
| max | 4.000000 | 30.000000 |
01_demo — Notebook de test#
from sklearn.datasets import load_iris
from sklearn.model_selection import train_test_split
from sklearn.linear_model import LogisticRegression
from sklearn.metrics import accuracy_score

X, y = load_iris(return_X_y=True)
Xtr, Xte, ytr, yte = train_test_split(X, y, test_size=0.2, random_state=0)

clf = LogisticRegression(max_iter=200)
clf.fit(Xtr, ytr)
pred = clf.predict(Xte)
print("Accuracy:", accuracy_score(yte, pred))
Accuracy: 1.0